Ask us!
Digital Scholarship / Digital Humanities
Data visualization & analysis
- Representation of data:
- Is the purpose to accurately and clearly share date in a non-biased way?
- Or is it trying to attract viewers and promote a certain perspective?
- All representations are by their very nature not reality - how close can you get to the truth?
- What questions could you answer with your data? What trends or relationships do you see?
- Quantitative vs. qualitative analysis - do you just want to know what, or do you want to know why?
- Data analysis is a desirable skill relevant to many fields and disciplines.
- Students can either create visualizations themselves or analyze existing examples.
Check out this historically and culturally significant example of data visualization available at the Evelyn S. Field Library!
-
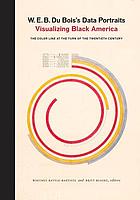 W.E.B. Du Bois's data portraits: visualizing Black America : the color line at the turn of the twentieth century
by
Call Number: E185.86 .D846 2018Publication Date: 2018At the 1900 Paris Exposition, the famed sociologist and civil rights activist W.E.B. Du Bois presented a series of groundbreaking data visualizations advocating for African American progress. These graphs, charts, and maps provided powerful glimpses into the lives of black Americans to convey both a literal and figurative representation of what Du Bois famously referred to as "the color line." From advances in education to the lingering effects of slavery, these infographics - beautiful in design and impactful in content - made visible a wide spectrum of black experience.
W.E.B. Du Bois's data portraits: visualizing Black America : the color line at the turn of the twentieth century
by
Call Number: E185.86 .D846 2018Publication Date: 2018At the 1900 Paris Exposition, the famed sociologist and civil rights activist W.E.B. Du Bois presented a series of groundbreaking data visualizations advocating for African American progress. These graphs, charts, and maps provided powerful glimpses into the lives of black Americans to convey both a literal and figurative representation of what Du Bois famously referred to as "the color line." From advances in education to the lingering effects of slavery, these infographics - beautiful in design and impactful in content - made visible a wide spectrum of black experience.
Tableau Public
Free platform to display visualizations; download open source software to work with data: https://public.tableau.com/s/
- The only way to save the visualization is to upload to the public site, so don't use any private or sensitive data!
- Unique terminology makes this tool challenging to use, but the website offers many examples that can be analyzed rather that creating them yourself.
- Variety of visualization options and styles, including charts, graphs, maps, and much more!
- How-to videos available here: https://public.tableau.com/en-us/s/resources
Tableau Public introductory video
This brief video introduces you to the platform and demonstrates how to upload and work with data to create a visualation, or "viz."
Additional options
These other free web-based platforms may be more accessible to your students
-
PiktochartCreate visualizations and infographics, as well as posters, presentations and more. Free account gets 5 visuals.
-
VismeCreate charts, graphs, infographics, videos, and more. Free account gets 5 visuals.
-
CanvaCreate charts, graphs, infographics, and more. Free account gets two folders to organize designs, 1GB storage.